
HASCOL Hascol Petroleum Ltd. Intraday Analysis 1st June 2020
Under Pressure
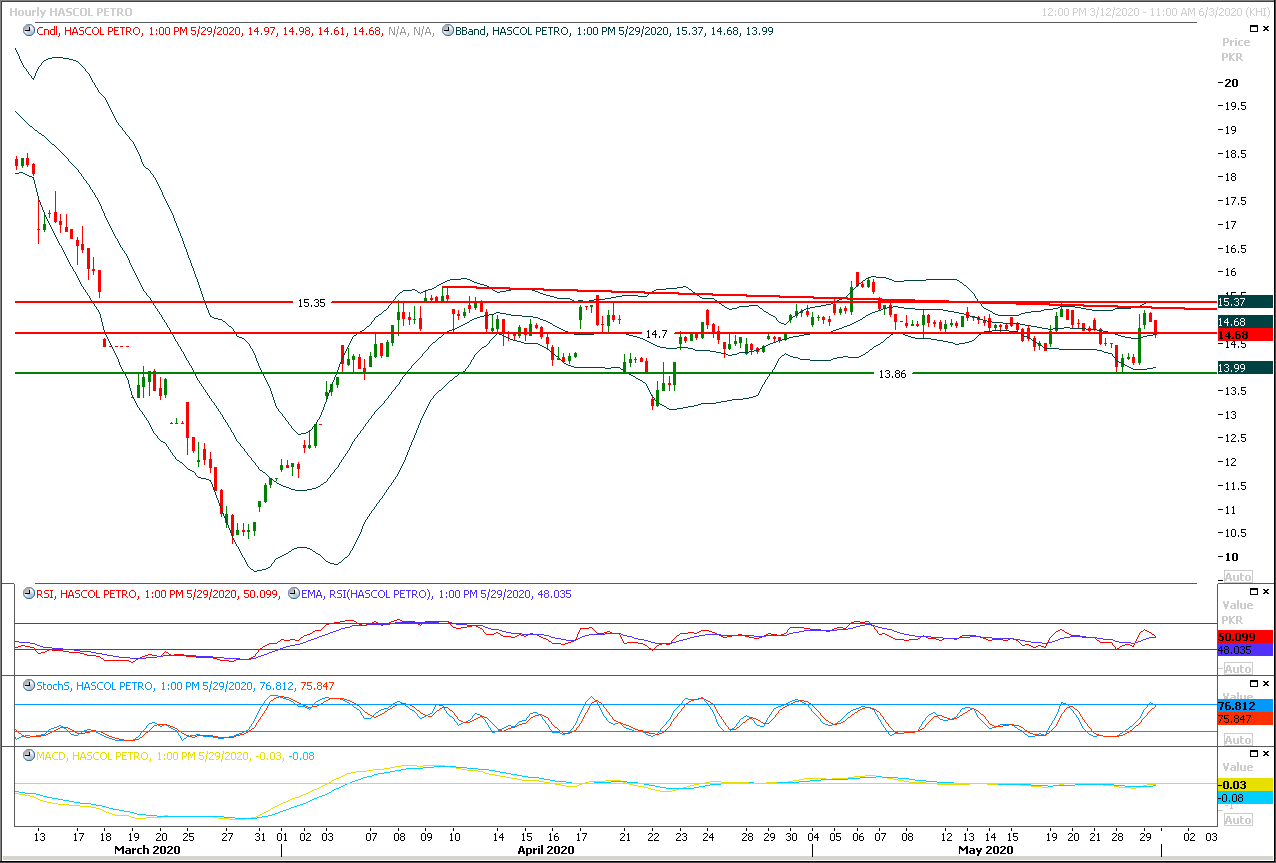
Our Pivot: 15.70
Our Preference: Start short selling Hascol below 14.70 and average it out till 15.30 with strict stop loss of 15.70 and profit target at 14 and 13.86.
Alternate Scenario: Upward penetration of 15.70 will call for 16.60.
NOTE: HASCOL is being capped by descending trend line along with a strong horizontal resistant region, meanwhile hourly momentum indicators have changed their direction towards bearish side.
Hourly Chart with Supports & Resistances:
HASCOL 3
Overview
Quick Snapshot
Free Float
599,472,408
O/S Shares
199,120,680
Market Cap. (m)
0.00
Var Value
15.50
Hair Cut
22.50
Last Price
Price Adjusted
52 Weeks Range
52w Low
52w High
Intraday
Pivots
| Level | 1st | 2nd | 3rd | Supports | 0.00 | 0.00 | 0.00 | Resistances | 0.00 | 0.00 | 0.00 |
|---|
Adjusted
Price Performance
Time Frame
Price Ch
%Ch
MTD Price Return
0.51
10.41
QTD Price Return
0.51
10.41
3M Price Return
-1.29
-19.25
6M Price Return
-0.14
-2.52
9M Price Return
-2.08
-27.77
YTD Price Return
-0.80
-12.88
1Y Price Return
-4.09
-43.05
3Y Price Return
-28.32
-83.96
5Y Price Return
-71.14
-92.93