
TRG The Resources Group of Pakistan Mid-Term Analysis 26 Dec. 2016
TRG PakistanSupport Services |
Price: 43.49Change: 0.08 2016-12-23 |
||||||
| Open: | 43.41 | 52 Week High: | 47.87 | Market Capitalization Mln: | 23719.04 | ||
|---|---|---|---|---|---|---|---|
| High: | 44.20 | 52 Week Low: | 22.33 | Outstanding Shares. Mln: | 545.39 | ||
| Low: | 43.30 | 52 Week Avg.: | 35.55 | KSE AllShares % Weight-age: | 0.25 | ||
| Close: | 43.49 | 52 Week Max Vol.: | 58302000 | KSE100 % Weight-age: | 0.84 | ||
| Average: | 43.60 | 52 Week Min Vol.: | 1330000 | KSE30 % Weight-age: | 1.27 | ||
| Volume: | 2702000 | 52 Week Total Vol.: | 3224728500 | Data Last Updated: | 2016-12-23 | ||
Rebound Insight
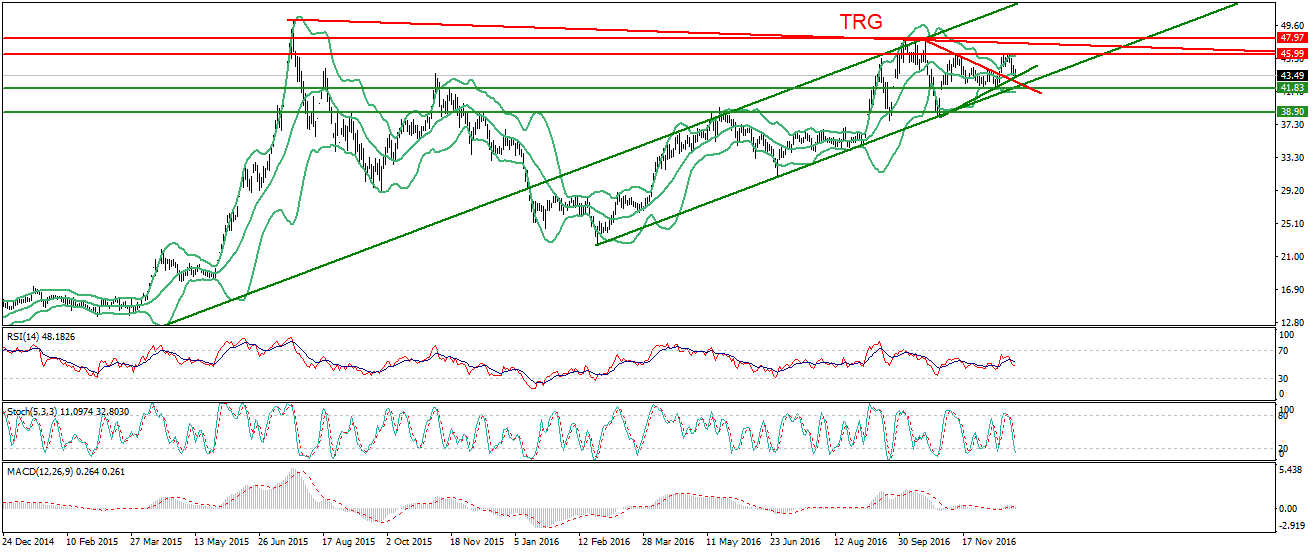
Our Pivot: 38.90
Our Preference: Buy TRG as long as 41.83 is sustained as support with strict stop loss of 38.90 and profit target at 46 and 48 with extension towards 51.25.
Alternate Scenario: Downward penetration of 38.90 will call for 36.63 and 34.02
NOTE: TRG is moving in an upward price channel and right now its getting support from a rising trend line inside that channel along with a horizontal supportive region. It already have penetrated its daily triangle in upward direction and after retesting its supportive region TRG can move for expansion of its triangle during completing fifth primary wave of its weekly Elliot wave.
Recommendations:
Buy above 42.85 and average it out till 41.83 with strict stop loss of 38.90 and target at 48 with extension towards 51.25.
Daily Chart with Supports and Resistances:
TRG 42
Quick Snapshot
463,582,065
545,390,665
0.00
16.50
22.50
52 Weeks Range
Pivots
| Level | 1st | 2nd | 3rd | Supports | 0.00 | 0.00 | 0.00 | Resistances | 0.00 | 0.00 | 0.00 |
|---|